Don't just view the chart. Improve the data behind it.
Build custom dashboards with 14 widget types. Connect your analytics sources. See what's working, then fix what isn't — all in one workspace.
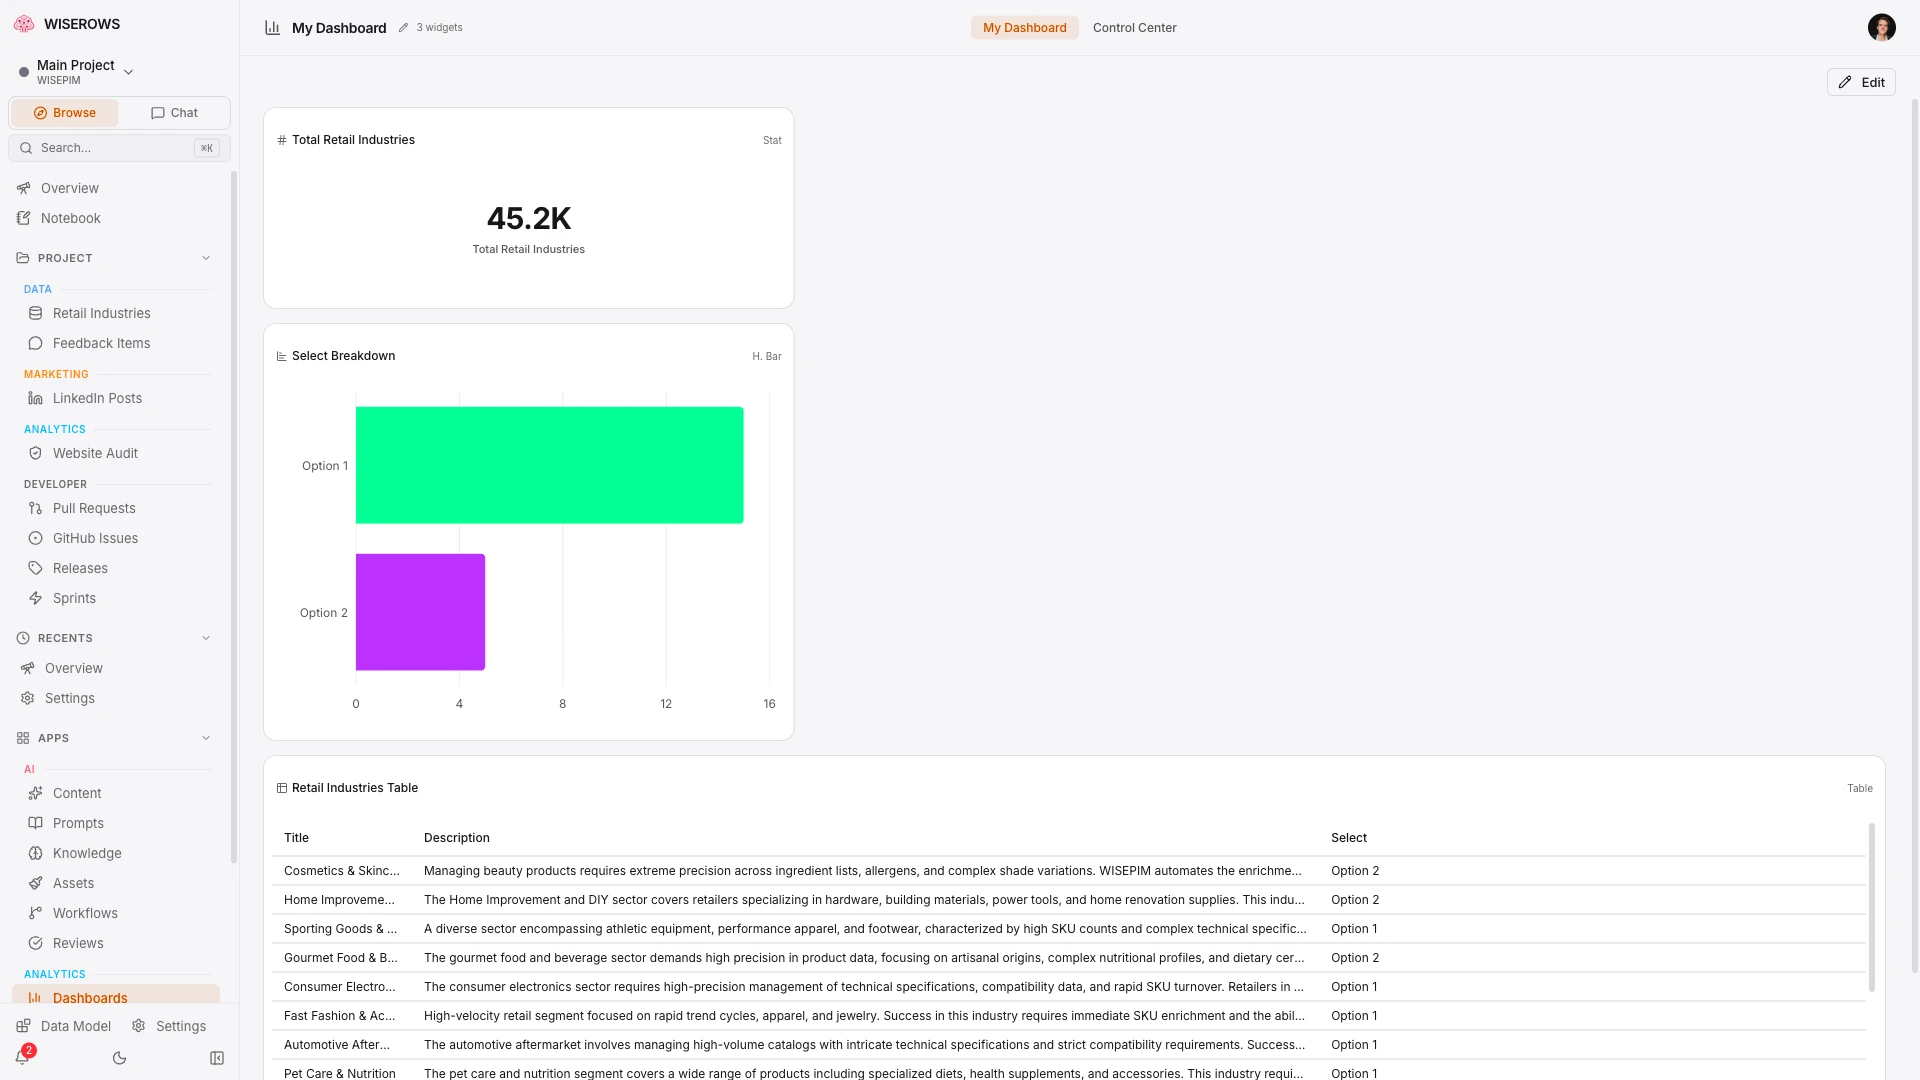
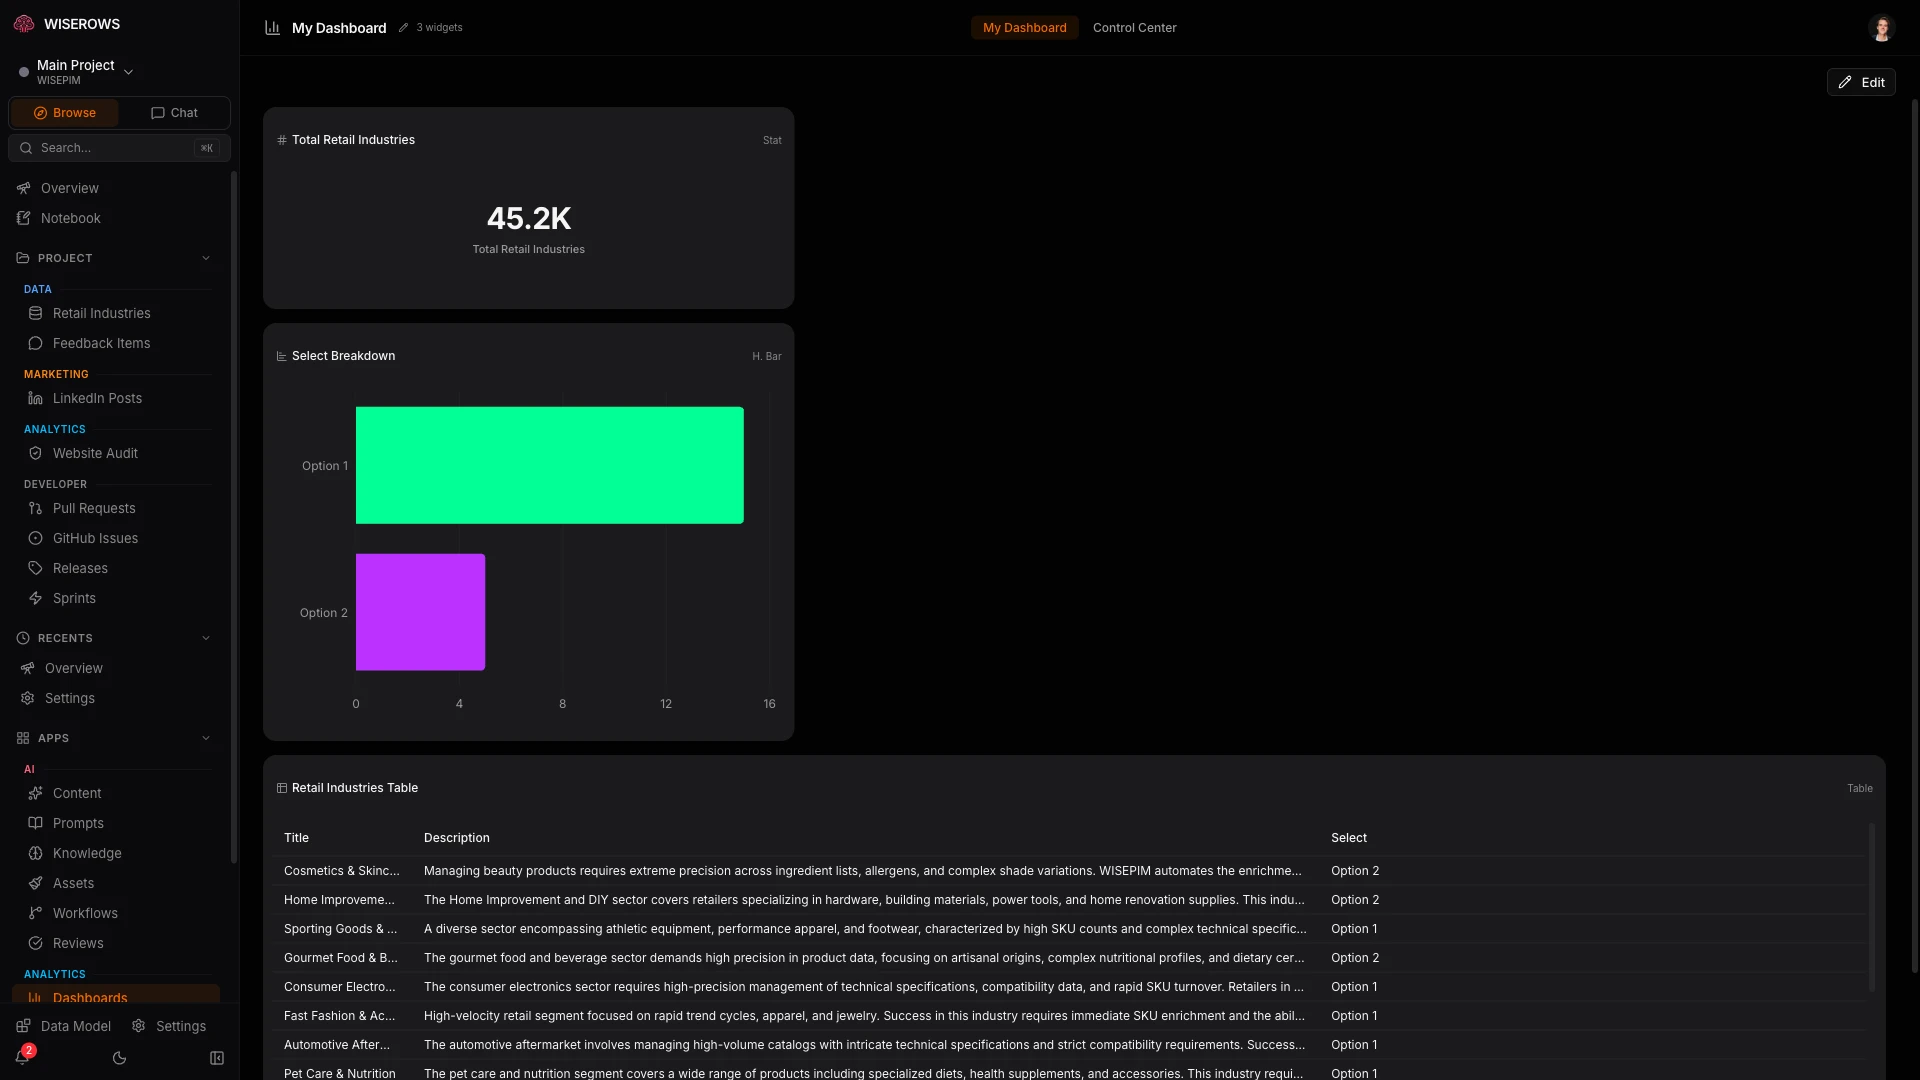
14 widget types
From simple stat cards to interactive charts — pick the right visualization for your data.
Drag, drop, and resize
Build dashboards visually. Add widgets, drag them into position, and resize to fit your workflow. Every dashboard saves its layout per user.
- Drag-and-drop widget placement
- Resizable grid layout
- Per-user layout persistence
- Quick-create widgets from data context
- Full-screen widget expansion
Connect your analytics sources
Pull data from the tools you already use into a single, unified view.
Google Search Console
Track impressions, clicks, CTR, and position for every page. See which content drives organic traffic and identify ranking opportunities.
PostHog
Product analytics, session replays, and feature flags. Understand how users interact with your published content.
Google Analytics
Traffic, conversions, and user behavior. Connect GA4 for a complete picture of your marketing performance.
Content ROI
Attribute revenue and conversions to individual content pieces. See which blog posts, glossary terms, and landing pages actually drive results.
- Revenue attribution per content piece
- Conversion tracking from analytics sources
- ROI scoring and ranking
- Content performance trends over time
SERP Tracker & Keywords
Track your ranking positions over time, organize keywords into clusters, and identify quick wins — pages that are close to ranking on page one.
- Daily position tracking per keyword
- Keyword clustering by topic
- Quick win identification (positions 5-15)
- Competitor position comparison
- Search volume and difficulty metrics
AI Insights
AI-generated recommendations scored with ICE (Impact, Confidence, Ease). Expert personas analyze your data and surface actionable improvements.
- ICE-scored recommendations
- Expert persona analysis (SEO, Content, Growth)
- Automated opportunity detection
- Weekly insight digests
Update 12 glossary pages ranking #5-10 — potential 40% click increase
Add internal links between comparison pages — boost topical authority
Create landing pages for 5 high-volume unranked keywords
Ask your data anything
Connected analytics become queryable from AI chat. Ask about trends, compare periods, find underperforming content — no SQL needed.
- "Show me pages with high impressions but low CTR"
- "Compare this month's traffic to last month"
- "Which glossary terms rank in positions 5-15?"
- "What content should I update for quick wins?"
Here are your top 5 pages by clicks this week:
More than a dashboard
Analytics aren't just for viewing — they're connected to your entities and queryable from chat.
Unified Dashboard
All your analytics in one place. Configurable widgets that pull data from any connected source.
Chat-Queryable
"What are my top 10 pages by clicks?" — ask analytics from chat and get instant answers.
Entity-Level Metrics
Attach analytics to entity fields. A blog post can show its GSC clicks right in the table.
SERP & Keywords
Track ranking positions, manage keyword clusters, and find quick wins for SEO improvement.
Content ROI
Attribute revenue and conversions to individual content pieces. Know what actually drives results.
AI Insights
ICE-scored recommendations from AI expert personas. Actionable improvements, automatically surfaced.
Dashboards that connect back to the data. Most dashboard tools are read-only — you see a chart, then switch to another tool to fix the problem. WISEROWS dashboards link directly to the underlying entities. See a dip? Click through, find the underperforming content, and improve it — all without leaving the platform.